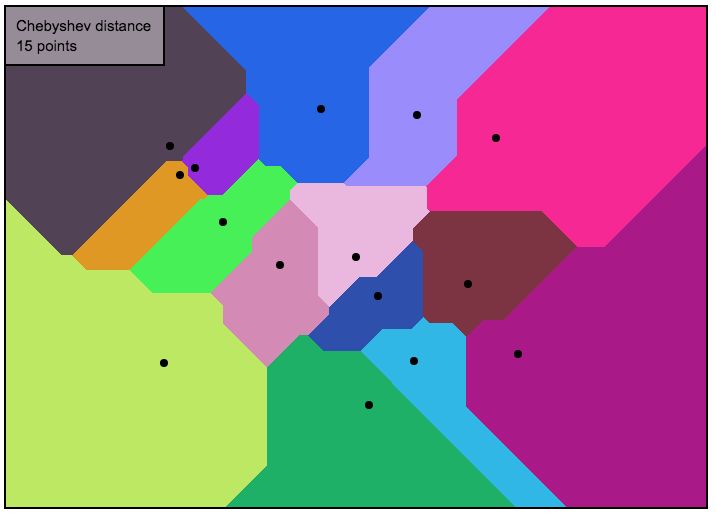
My friend and colleague, Sarah Yvonne Greer, is currently in her senior year. She used her passion on llamas to design her cool cozy personal website. It contains some very interesting mathematical visualization projects, including this interactive Voronoi diagram.
Her work was linked on the Agile Scientific’s blog post The norm: kings, crows and taxicabs by Matt Hall; the figure in the very beginning is from that post. She also got a chance to join the Undersampled Radio show Game, Set, Match recently.
Unlike she having a dedicated server in Oregon, I host this website in Git Pages for free. Therefore I am limited to using static pre-generated web pages. The architecture that I am using now is Hexo. Yet I wanted to explore the interaction feature out of its poor Javascript support. After tiny teeny adoptions, I managed to brutally reproduce it here.
About
You can read more about this interactive Voronoi diagram on Wolfram MathWorld and Wikipedia. In this demonstration, there are 3 different metrics. The table below describes them. Essentially, these metrics represent $L_1$, $L_2$, and $L_\infty$ distance, respectively, between the point of interest $\mathbf{a}=(x_1,\,y_1)$ (denoted by black dots on the above display) and any other point $\mathbf{b}=(x_2,\,y_2)$ on the plane.
| Name | Measurement |
|---|---|
| Manhattan distance | $\Vert\mathbf{b}-\mathbf{a}\Vert_1 = \vert x_2-x_1\vert + \vert y_2-y_1\vert$ |
| Euclidean distance | $\Vert\mathbf{b}-\mathbf{a}\Vert_2 = \sqrt{(x_2-x_1)^2 + (y_2-y_1)^2}$ |
| Chebyshev distance | $\Vert\mathbf{b}-\mathbf{a}\Vert_\infty = \max{(\vert x_2-x_1\vert,\,\vert y_2-y_1\vert)}$ |
Instructions
- Click anywhere on the canvas above to add a point.
- Use the buttons below the canvas to change the measured metric and clear the display.
Alternatively, you can press 1 to use the Manhattan distance, 2 to use the Euclidean distance, 3 to use the Chebyshev distance, n to toggle through all metrics, and R to clear the display.
Here’s a bug!
What?
Weirdly, I found a very subtle bug that only occurs here but not in Sarah’s original page. You can follow the instructions below to reproduce this bug in the next demo (I fixed this bug in the first demo).
- Click on the diagram to see the result;
- Click the button to change metric norm (Do NOT use shortcut keys! Bug only happens when clicking buttons);
- Click the diagram again, you will see incorrect small circles instead of correct segmentations.
Solution
I found that it’s related to the function updatePoints from the code voronoi.pde.
Notice that int n is declared as a global variable; however, in updatePoints it was only called as a local dummy variable. It leads to a very dangerous ambiguity: how should these two variables with the same name but different scope be related? Often this is an environment-dependent result. Eventually I fixed it by explicitly updating the value of the global variable int n:
If you haven’t gotten bored yet, go back to the first interactive demo and see whether the bug is solved.
Source code
You can download the source code from Sarah’s website here (ZIP file, 20kB). You will need Processing.js to run the program, not the Processing software package she mentioned. ![]()
![]()